Executive Reading Guide
The report should leave the team able to answer four questions.
- What operating pattern are we seeing?
- What evidence supports or challenges that pattern?
- What decision is required now?
- What will we monitor to know whether conditions improve?
Read the report as an operating decision—not a scorecard
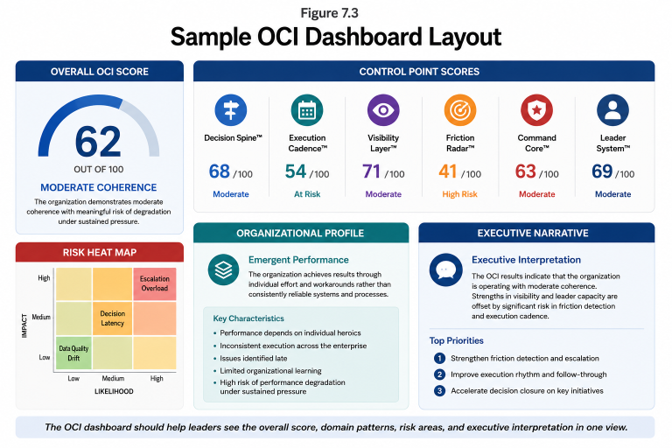
The Operational Coherence Index™ is not an employee-engagement survey, a personality assessment, or a dashboard to admire at the end of a meeting. It is a structured view of how leaders experience the operating conditions around the work: whether decisions move, whether the right signals reach the right people, whether friction is surfaced early, and whether leadership can coordinate under pressure.
That makes the report useful only when it changes the next leadership conversation. The aim is not to defend a number. It is to identify the pattern, test it against what is happening in the work, decide what must change, and establish evidence that will show whether conditions improve.
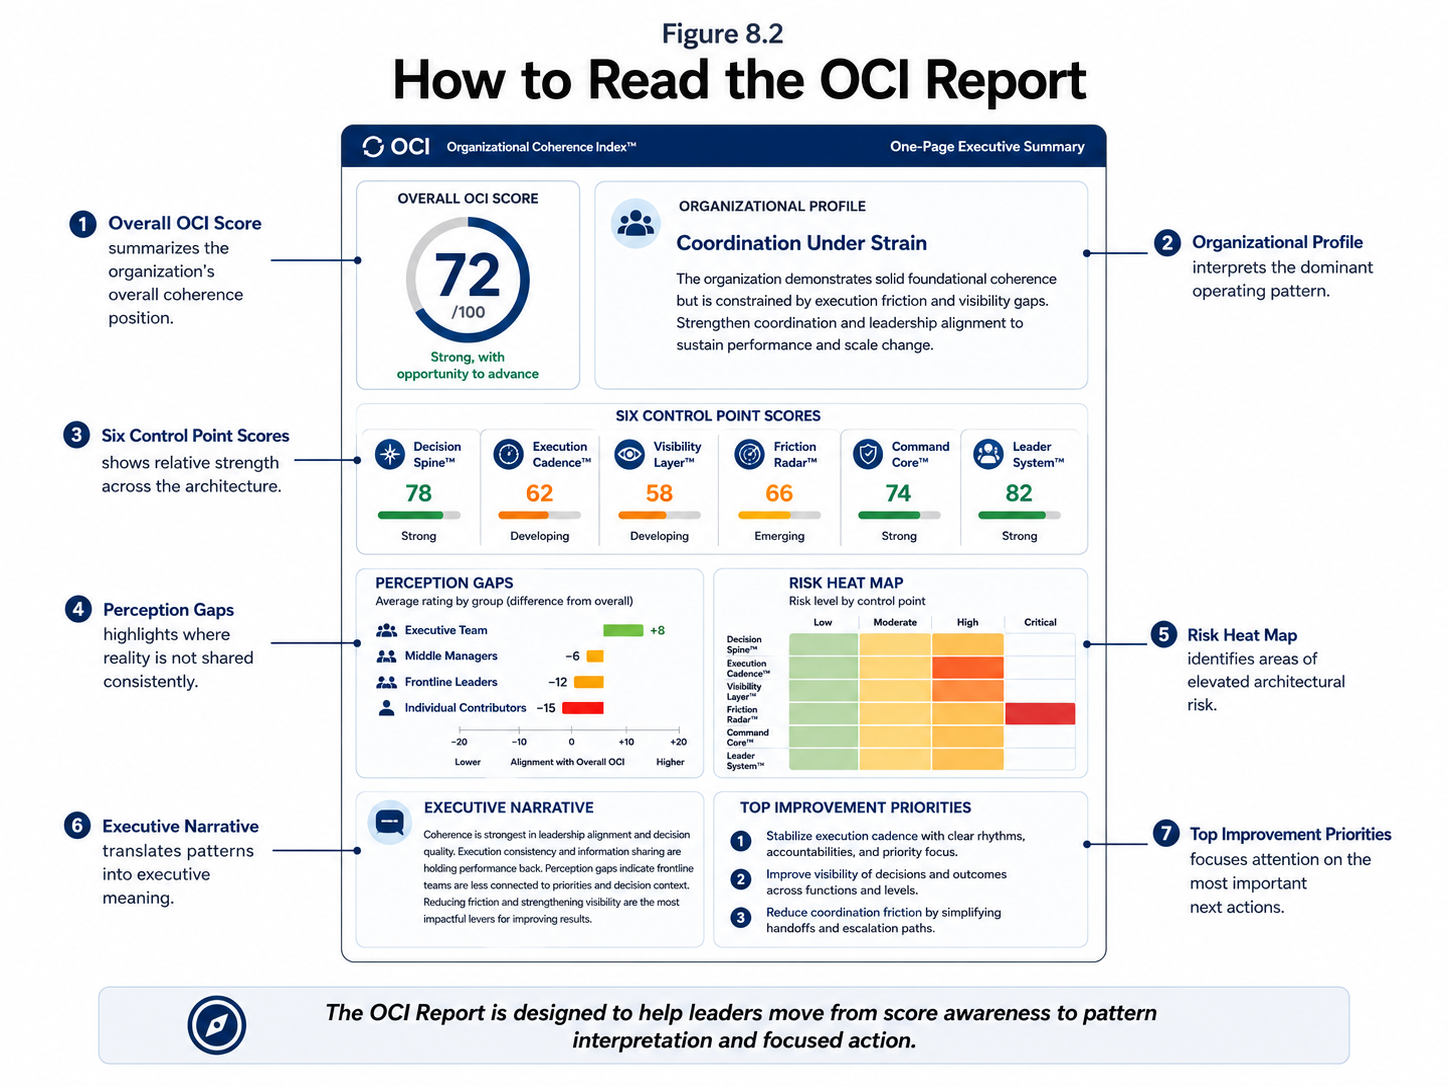
OCI is designed to give executives a disciplined way to make that transition. It moves from individual reflection, to aggregate visibility, to diagnostic interpretation, to focused action. No single chart should be treated as the whole diagnosis.
How the Stability Edge measurement system works
The Operational Coherence Index™ measures how leaders and other participants experience the organization’s operating conditions. It assesses whether decision ownership feels clear, leadership cadence produces follow-through, operational reality becomes visible, friction is surfaced early, coordination holds across functions, and leaders have sufficient capacity to carry the work.
OCI does not, by itself, measure operational performance. It measures the human experience of the leadership architecture responsible for supporting that performance.
Stability Edge therefore pairs OCI with four organizational operating measures. Issue-to-Resolution Cycle Time measures how long an operational issue takes to move from identification to verified resolution. Workflow Execution Consistency measures whether critical workflows are being performed reliably across departments, units, shifts, and time periods.
Command-Center Decision Rhythm measures whether leadership huddles and command structures consistently convert operational signals into decisions, named ownership, coordinated action, and follow-through. The 90-Day Coherence Recovery Profile tracks whether decision-making, workflow reliability, coordination, and leadership capacity improve and remain stable across the 30-, 60-, and 90-day recovery period.
Together, these measures provide two different but connected views. OCI is experience evidence: it shows how the operating environment is being experienced. The four operational measures are operational-performance evidence: they show whether performance in the work is actually changing. Neither view is sufficient alone.

Begin with the score, then check the pattern behind it
The overall OCI score is the front door to the report. It is calculated from the six control points on a 0–95 scale and gives leaders an initial read on the coherence of the participating group’s operating environment. The report’s performance bands provide orientation, but they do not replace interpretation.
A score can describe the current condition without predicting the future by itself. A 64, for example, falls in the OCI’s Strained band. That does not mean the organization is failing. It means the next leadership discussion should ask where strain is concentrated, how it might behave during the next difficult operating period, and what evidence could confirm or challenge that concern.
The executive question is not, ‘Is this score good?’ It is, ‘What does this pattern tell us about our capacity to coordinate the work that cannot fail quietly?’
Before You Interpret the Score
Check the conditions around the data.
- How many leaders participated, and how representative is the participation mix?
- Where does the overall average conceal meaningful variation by level, role, department, or location?
- Are there large perception gaps between executive, operational, and frontline leaders?
- Does the evidence describe one initiative, one period of strain, or the broader enterprise?
- What open-text evidence and local operating measures should be checked before priorities are set?
- Are small numeric differences being treated as a priority when the operating evidence does not support that conclusion?
OCI uses defined scoring rules, but the interpretation remains contextual. The assessment is strongest when leaders treat a score as a disciplined starting point for inquiry—not as a self-contained diagnosis.
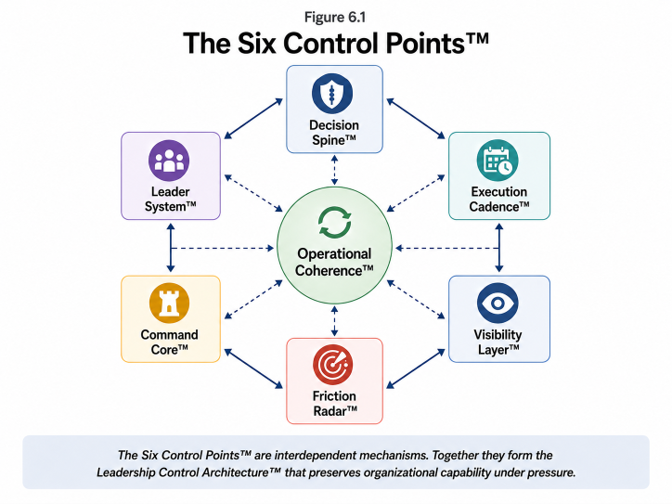
Use the six control points to find the connected exposure
Decision Spine examines clarity of decision ownership and accountability. Execution Cadence examines whether the organization reviews work, resolves issues, and adjusts with a dependable rhythm. Visibility Layer examines whether the people responsible for action can see the information they need in time.
Friction Radar examines whether the organization detects and resolves obstacles before they harden into workarounds. Command Core examines whether clinical, operational, technical, and executive leaders can align around trade-offs. Leader System examines whether the people carrying the work have the capacity and support to do so sustainably.
The priority is rarely the lowest individual number. The more useful question is which combination is creating operational exposure. Weak visibility and weak friction detection may mean the organization learns about problems after workarounds have formed. Weak decision ownership and a strained command core may mean issues are discussed repeatedly without a credible route to resolution. That is where Stability Edge differs from a conventional survey readout: it treats scores as evidence of a leadership-control pattern, not as isolated grades.
Read perception gaps as a leadership signal
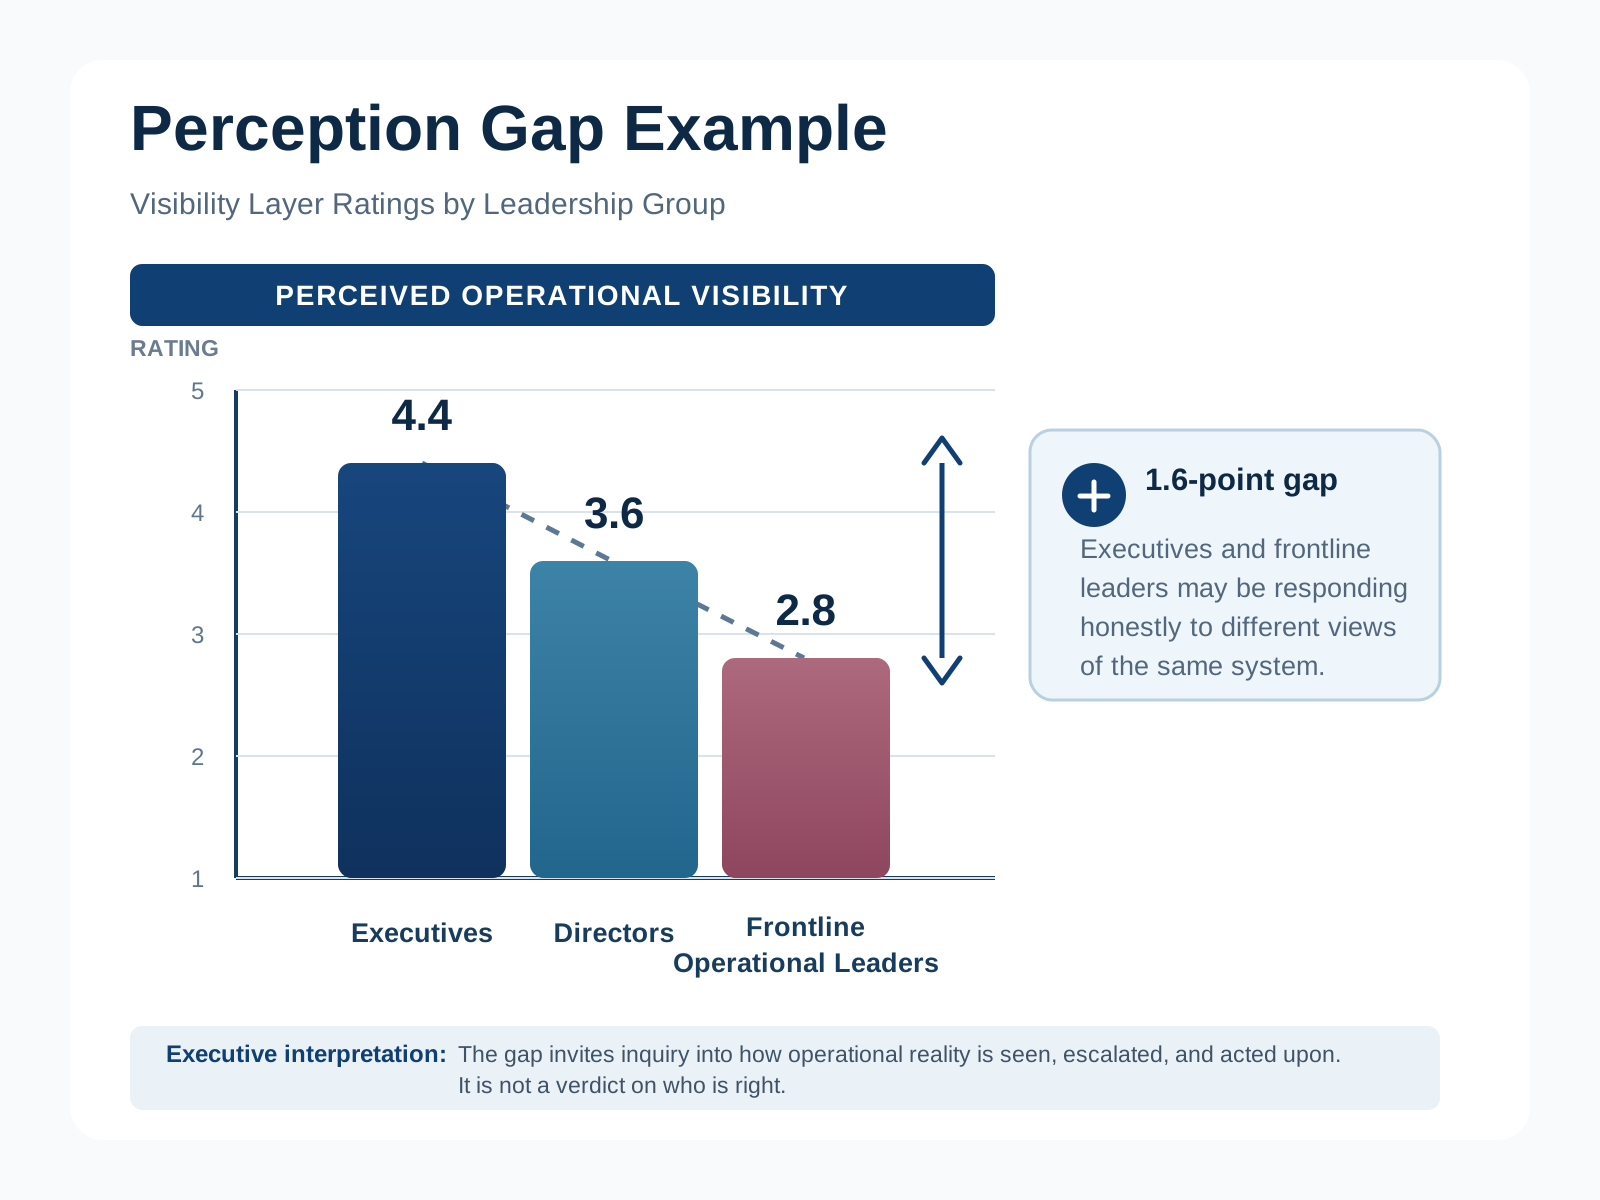
Aggregate averages can hide an important condition: senior leaders, operational leaders, and frontline managers may be experiencing the same system very differently. A perception gap does not prove that one group is right and another is wrong. It identifies a question the leadership team should examine together.
A gap in Visibility Layer, for example, may show that executives believe they have a reliable operating view while leaders closer to the work are receiving late, incomplete, or filtered signals. That is not simply a communications problem. It may be a control problem involving escalation rules, huddle design, data access, or the safety of speaking up.
Use the gap to prompt a joint inquiry: What can each group see? What reaches them too late? Where do they rely on informal workarounds? What decision is delayed because the operating picture is incomplete?
Use the heat map to choose where deeper attention goes
A risk heat map is a prioritization tool, not a prediction engine. It helps executives compare the severity and concentration of weaker conditions so the review does not become a tour of every issue in the organization.
The heat map should direct attention to the places where a control-point pattern has the clearest operational consequence. It does not decide the remedy. Before action, leaders should look for local evidence: issue age and rework, reopened items, huddle follow-through, workflow burden, delayed handoffs, throughput variation, service-desk patterns, or safety and quality signals that fit the question at hand.
This is the discipline that prevents overreading the data. OCI captures leaders’ experience of observable operating behaviors. Local measures help the team test where that experience is appearing in the work.
Illustrative Healthcare System Example
A fictional pattern: visibility looks stronger from the top than from the work.
Illustrative only. These figures demonstrate a reading method; they are not a client result.
What the numbers do and do not mean
The organization is not being told that it has a visibility problem everywhere. The contrast suggests that senior leaders may be receiving a more reassuring operating picture than the leaders who encounter friction first. The weaker Friction Radar score raises a more specific risk: issues may become visible only after local workarounds have already formed.
What evidence the team should check
Review repeat escalations, issue age, reopened items, unresolved handoffs, command-center decisions, and examples of informal tracking outside the expected process. Ask unit and department leaders what they are seeing before a concern reaches formal leadership review.
What decision the team should make
Name a single route for recurring workflow friction to reach the appropriate decision owner, define response expectations by issue type, and require a short feedback loop to the people who raised the signal. This is a leadership-control intervention, not simply a request for more reporting.
What to monitor next
At 30 days, test whether issues reach the right owner sooner. At 60 days, check whether reopened items and informal workarounds are declining. At 90 days, review whether the perception gap has narrowed and whether the new escalation discipline holds across units.
Close the review with a visible operating commitment
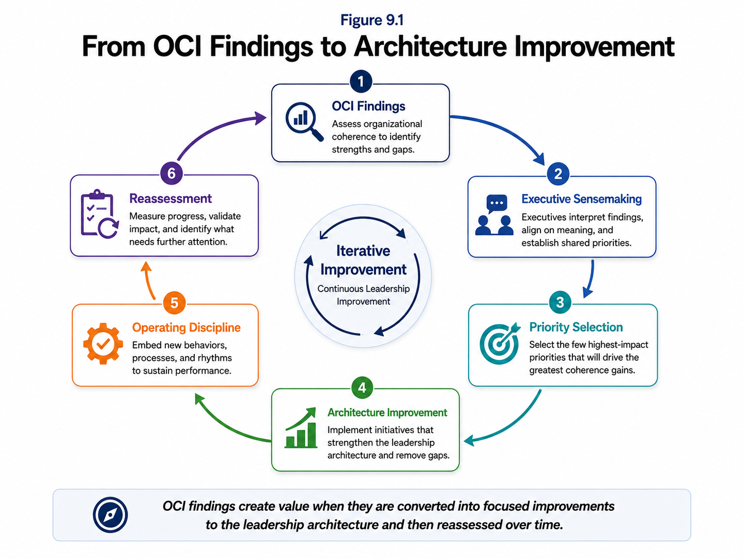
A productive OCI review is short enough to preserve attention and structured enough to end with a decision. Start with the dominant pattern. Select two or three findings with the clearest operational exposure. Ask the leaders closest to the work what they are seeing, then ask the executive sponsor to name the decision the organization needs to make.
For every priority, record one accountable owner, one forum where follow-through will be reviewed, one or two local measures, and a reassessment date. The issue is not closed because a task was completed. It closes when affected leaders can verify that the work improved.
That is the Stability Edge approach: the report becomes part of the organization’s control loop—signal, decision, action, and verification—rather than a consultant’s retrospective summary.
Use 30, 60, and 90 days to test whether recovery is holding
At 30 days, test whether ownership, escalation, and response discipline are becoming more reliable. At 60 days, look for whether those practices are reaching across units and whether repeat friction or perception gaps are narrowing. At 90 days, decide what has become durable, what remains exposed, and which operating practices should carry forward.
Do not declare victory because a new practice has been launched, and do not declare failure because a stubborn pattern has not disappeared immediately. Recovery is usually uneven. A credible review records what changed, what evidence moved, what remains uncertain, and what the organization will do next.
Sources and Related Evidence
Use the report with a clear view of its evidence base.
- Download the OCI Report Suite Guide — a practical overview of individual results, executive dashboards, diagnostic reports, and executive debriefs.
- AHRQ’s TeamSTEPPS situation-monitoring guidance — relevant evidence on building shared awareness across teams.
- AHRQ’s TeamSTEPPS leadership guidance — relevant evidence on clear roles, communication, and team coordination.
- IHI’s Whole System Measures guidance — a health-system perspective on using a coherent measure set for executive learning.
How Stability Edge Helps
Turn the pattern into a practical operating response.
Stability Edge helps healthcare executive teams connect leadership experience with local operating evidence, identify the control points under strain, and establish focused actions that can be reviewed through the recovery period. The work is designed to create a usable shared view, not another report that sits on a shelf.
Download the OCI Report Suite GuideTalk with MarkGet a Free 30-Minute Assessment CallFrequently Asked Questions
Questions leaders ask about this topic
What does an OCI report measure?
An OCI report measures how leaders experience six observable operating conditions: decision ownership, execution rhythm, usable visibility, friction detection, leadership alignment, and leader capacity. It is designed to reveal patterns that may affect coordinated action under pressure.
Does a lower OCI score mean the organization is failing?
No. A lower score signals that more of the operating conditions measured by OCI may be inconsistent or strained. The next step is to validate the pattern with local evidence and decide where focused action will reduce exposure.
Should executives act on a score alone?
No. OCI should be read alongside participation context, variation across leadership levels, open-text evidence, and local operating measures. The report directs inquiry; it does not replace judgment or clinical, quality, financial, or implementation measures.
Who should take part in the report review?
The executive sponsor should review the findings with clinical, operational, technical, and leadership groups who can explain the pattern and own follow-through. Cross-level discussion is especially important when the report shows perception gaps.
What happens after an OCI report is reviewed?
The strongest next step is a focused operating commitment: one owner, one review forum, one or two measures, and a reassessment date. A 30-, 60-, and 90-day view then tests whether conditions are improving and where further action is needed.